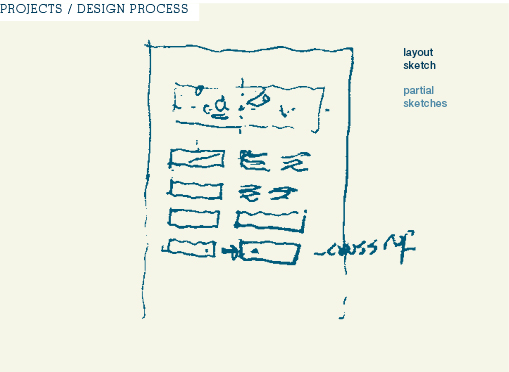
In addition to plotting all the correlations at once on a single graphic, the sketches also envisioned to display correlations between a select number of categories separately. These smaller graphics were accompanied by annotations that interpreted the significance of the relationships.
next


2
3


sketches
1