Scientific research benefits from the improvement of measuring instruments and the increasing accuracy of observations. The work of the scientist has evolved from physically constructing an experiment to now modeling information in digital environments. Computers produce an ever increasing array of visual outputs for scientists to interpretas well as use in visual displays of information—the inherent complexity of this new medium challenges all scientific reseach.Thus, the process of creatively integrating various graphics (photos, illustrations, charts, graphs) with text can be facilitated by the skills and insights of visual communication design.
A first step in this process is for the scientist to assume the 'eye' of the designer: step away from specifics of research at hand so as to examine the nature of infomation. Does, for example, the scale, movement, and complex layers in a given project require clarification and emphasis?
By identifying these key aspects, the next phase in the design process emerges: choosing the lines, shapes, and colors, that best interpret and articulate the research problem.


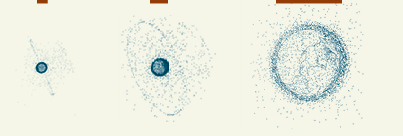
scale
finding the right way to indicate relative scale and its progressive change [astronomy]
finding the right way to indicate relative scale and its progressive change [astronomy]
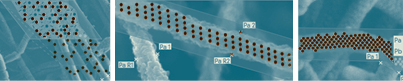
movement finding ways to indicate the nature of change in time [material science]
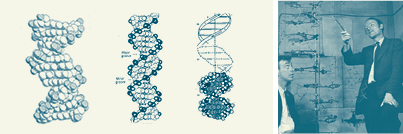
complex layers
separating information obscured by a tangle of layers [molecular biology]
separating information obscured by a tangle of layers [molecular biology]
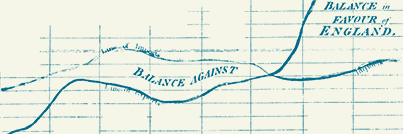
numeric information using geometry to give presence to numbers. William Playfair. [economic history]